
Sales Analytics Dashboard Excel Template
Visualize and optimize your sales performance
$39.99$29.99
Take control of your business performance with this ready-to-use Sales Analytics Dashboard Excel Template. Designed for entrepreneurs, managers, and sales teams, this interactive spreadsheet transforms raw sales data into clear, actionable insights.
✅ Key Features:
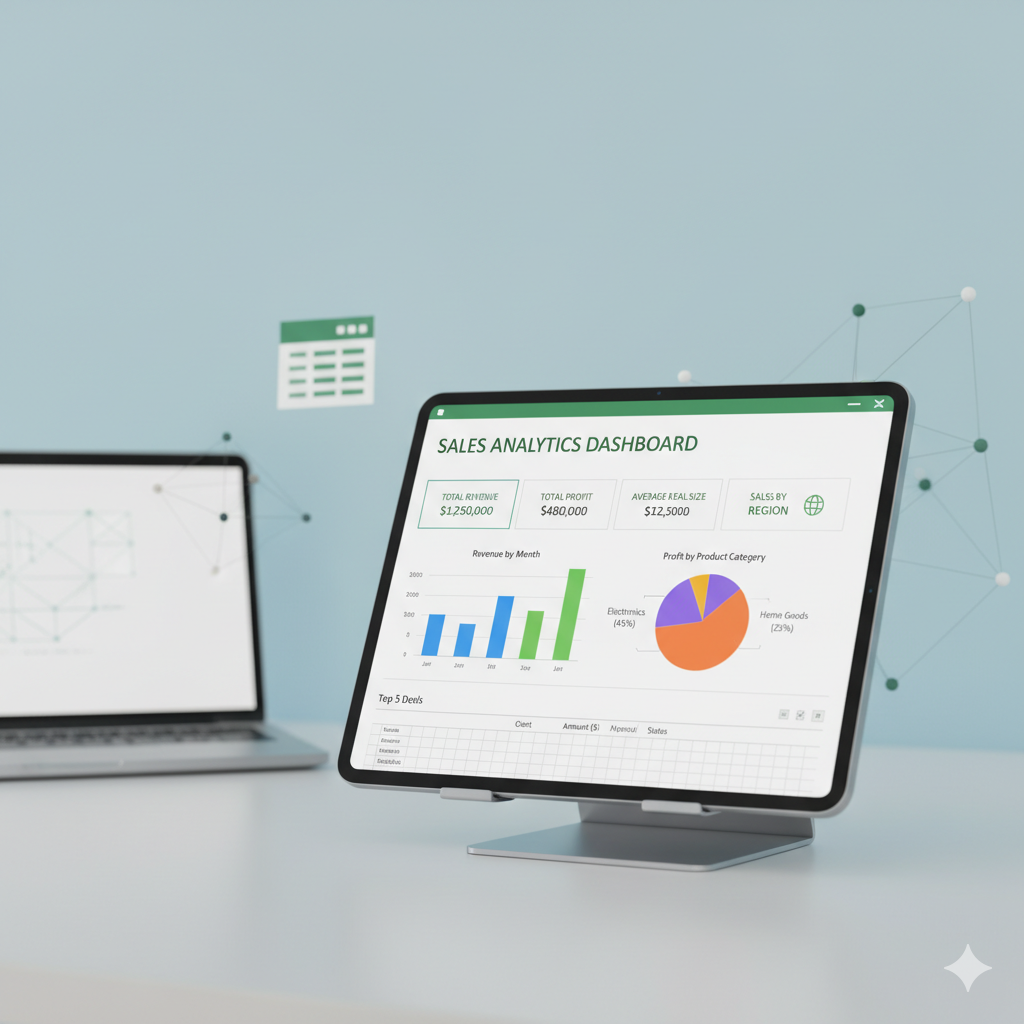
At-a-Glance KPIs: Instantly view Total Revenue, Total Profit, Average Deal Size, and Number of Deals.
Dynamic Filters: Use slicers to filter by Region, Deal Type, Contract Cycle, and Month.
Visual Insights:
Sales by Region (Bar Chart)
Revenue by Deal Type (Pie Chart)
Revenue by Deal Division (Bar Chart)
Revenue by Month (Bar Chart)
User-Friendly Design: No advanced Excel skills required — simply enter your data and the dashboard updates automatically.
Professional Layout: Clean and modern design perfect for presentations, client reports, and internal performance tracking.
🎯 Who Is This For?
Small business owners
Sales managers & teams
Freelancers and consultants
Anyone needing data-driven insights to improve performance
💡 Why Choose This Template?
Unlike generic spreadsheets, this dashboard is built to give you instant clarity on your sales performance — helping you spot trends, track progress, and make smarter decisions with confidence.
🔹 What You’ll Get
1 Excel file (.xlsx) with built-in charts & filters
Ready-to-use template (just replace sample data)
Instant digital download — start analyzing today
📦 Instant Download. Easy to Use. Boost Your Sales Strategy Today!